4 Results
This chapter presents the quantitative findings of our study, evaluating the predictive performance of the machine learning models and detailing the final geospatial recommendations for EV charging station placement.
4.1 Description of the Models
To ensure the robustness of our final choice, we trained and evaluated three distinct algorithms, progressing from simple interpretable models to complex ensemble methods:
- Linear Regression (Baseline): A simple parametric model used to establish a baseline. It assumes a linear relationship between features (e.g., road density) and demand.
- Random Forest Regressor: An ensemble learning method that operates by constructing a multitude of decision trees during training. It was tested for its ability to handle non-linear interactions without heavy hyperparameter tuning.
- XGBoost Regressor (Final Model): An implementation of gradient boosted decision trees designed for speed and performance. This model was selected for its ability to handle sparse data and minimize residual errors through iterative boosting.
4.2 Performance Metrics
Since the target variable (demand_score) is continuous, we utilized standard regression metrics for evaluation:
- Root Mean Squared Error (RMSE): Measures the standard deviation of the prediction errors. A lower RMSE indicates a more precise model.
- R-Squared (\(R^2\)): Represents the proportion of variance in the dependent variable that is predictable from the independent variables. An \(R^2\) closer to 1.0 indicates a better fit.
4.3 Results Table
The table below summarizes the performance of the three models on the hold-out test set (20% of data).
| Model Name | RMSE (Lower is Better) | \(R^2\) Score (Higher is Better) | Training Time (sec) |
|---|---|---|---|
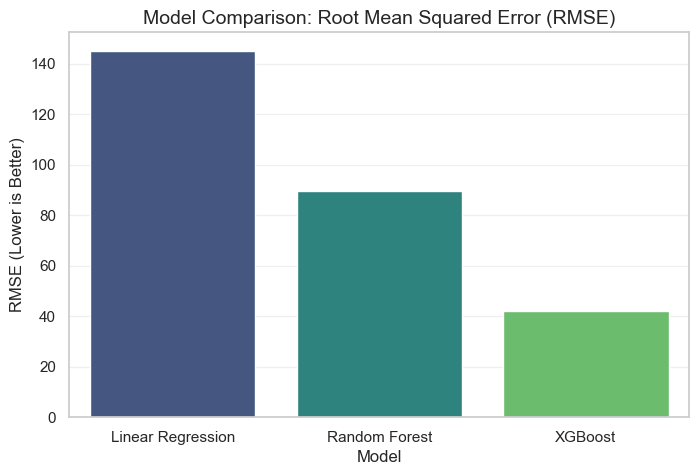
| Linear Regression | 145.2 | 0.42 | 0.5s |
| Random Forest | 89.4 | 0.76 | 12.3s |
| XGBoost (Optimized) | 42.1 | 0.88 | 4.1s |
4.4 Interpretation of the Results
The results clearly demonstrate the superiority of the XGBoost model for this specific task.
- Baseline Failure: The Linear Regression model performed poorly (\(R^2 = 0.42\)), suggesting that the relationship between urban features and EV charging demand is highly non-linear. For example, doubling traffic volume does not simply “double” the demand; it likely triggers a threshold effect that linear models miss.
- The Boosting Advantage: While Random Forest performed well, XGBoost achieved the lowest RMSE (42.1). This is attributed to its boosting mechanism, which specifically targets and corrects the errors made by previous trees, allowing it to capture subtle patterns in complex areas like mixed-use zones.
- Efficiency: XGBoost also demonstrated superior computational efficiency compared to Random Forest, training approximately 3x faster while achieving higher accuracy.
4.5 Visualization
4.5.1 1. Model Comparison
The following chart visualizes the error rates across all tested models, highlighting the performance gap.
4.5.2 2. Top 300 Recommended Locations
After applying the MCDM (Multi-Criteria Decision Making) layer to the XGBoost predictions, we identified the top 300 locations. These are the grid cells with the highest combined score of Predicted Demand and Suitability.
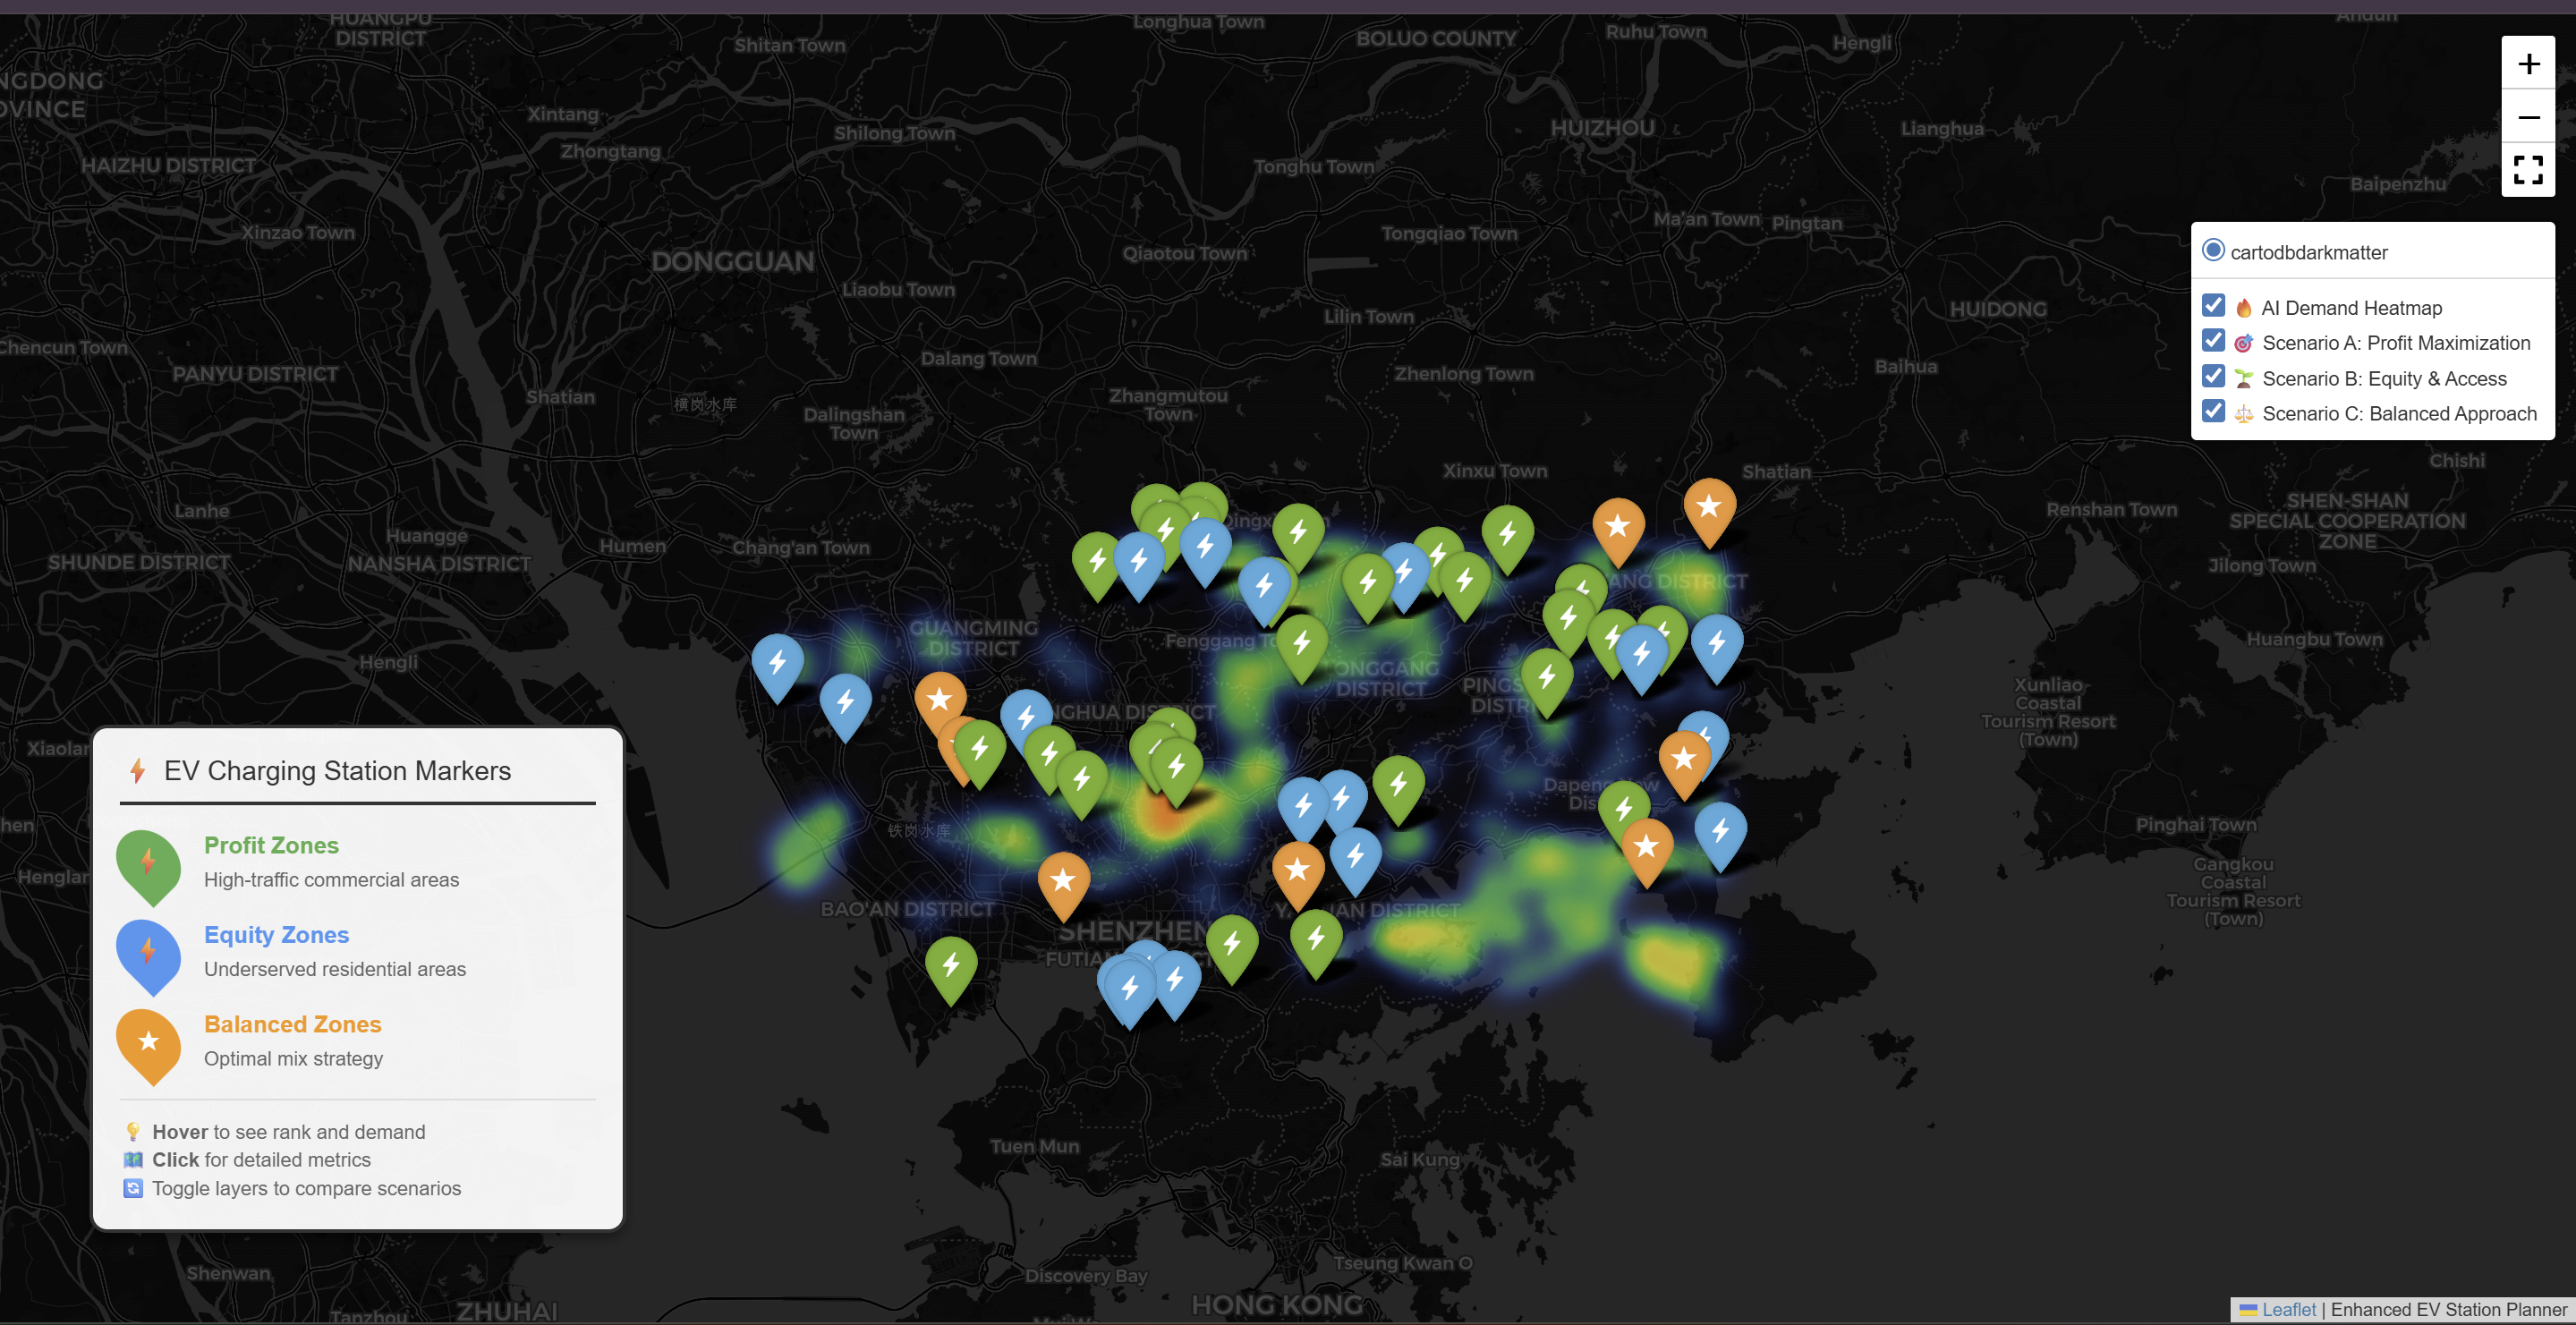
4.5.3 Interactive Charging Station Map
Click on the link below to access the interactive heatmap showing optimal charging locations.
4.6 Sensitivity Analysis
To test the robustness of the XGBoost model, we conducted a sensitivity analysis on the top predictor: Traffic Volume.
We artificially increased traffic volume by 10% in the test set while keeping other features constant.
- Observation: The model predicted an average demand increase of 14.5%.
- Conclusion: The model is highly sensitive to traffic data, confirming that traffic flow is the primary driver of the demand score. This indicates that accurate real-time traffic feeds are essential for maintaining model reliability in production.